
My weather system is a collection of sensors that gathers environmental data and writes it to a log file. It is built on a pair of Raspberry Pi model Zero-W single board computers running hardware and software of my own design. One collects data from inside my house and another that collects outside data. The system consists broadly of two independently running parts. The software that collects the data and writes it to a “flat file database” which runs every five minutes, and the software that runs at ten minute intervals, that reads this “database” and produces graphs that are transmitted to my web servers.
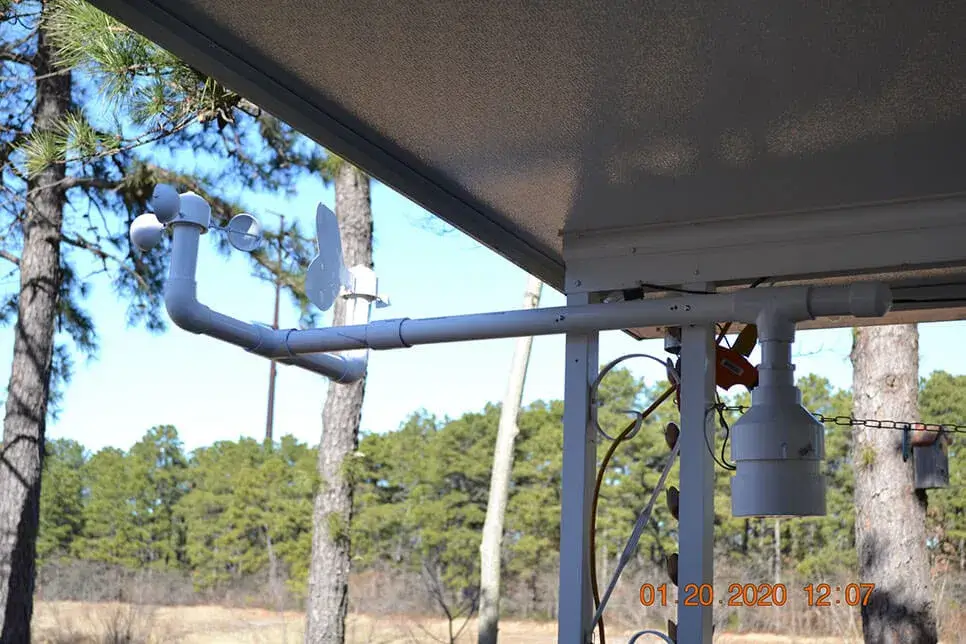
The hardware consists of a suite of sensors attached to the outside node (pictured above) which includes temperature, humidity, air pressure sensors, a tipping bucket rain gauge (not visible), an anemometer, and a wind vane. The anemometer and wind vane are based on a design from Fascinating Electronics. The outside computer is housed in the round container on the right end of the sensor arm pictured above. A separate inside node has only the temperature, humidity, and air pressure sensors.
The Sensors
The Anemometer is a device that measures wind speed. It consists of a rotating cap with cups attached at 120 degree intervals and a sensor to detect how fast the cups are rotating. The anemometer I designed has a magnet attached to the inside of the rotating cap. Inside the stationary tube there is a single hall sensor, positioned such that it detects when the magnet is close.
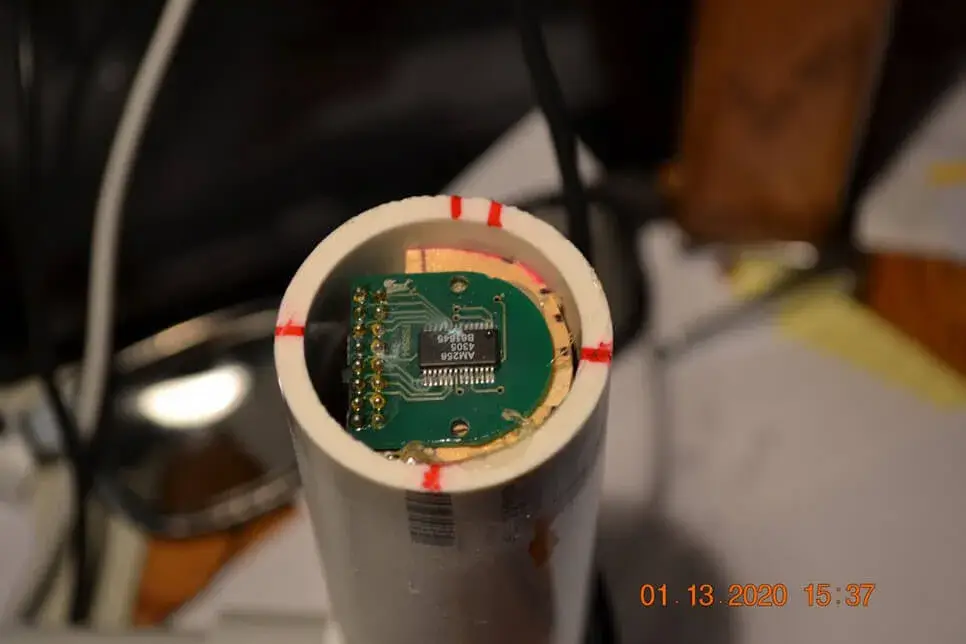
The wind vane is responsible for determining which direction the wind is coming from. Inside the wind vane rotating cap there is a radially oriented magnet attached to the center bolt which rotates with the wind vane. Its position is sensed by the RLS RMK2 hall effect angle sensor. The sensor is an evaluation sample given to me free of charge by RLS. I have covered it with several coats of clear acrylic to protect it from the elements since the sensor is not intended to be outside.
The weather station is operational, and located in Toms River on the New Jersey coast. Live data can be seen at: http://Webyray.com